Wellbore Diagram Solution
Real-time well visibility for cleaner stage execution
A good wellbore diagram gives crews immediate context: where slurry is now, where each step is moving, and how stage and step totals compare in real time. The result is faster decisions and fewer costly surprises at target depth.
What end users gain
Faster situational awareness
Operators can instantly see where the active step is in the well and how close it is to key perforation targets.
Better pumping accuracy
Planned versus actual slurry totals are visible by step, helping crews correct early before drift becomes a larger issue.
Lower communication friction
A shared visual reference reduces ambiguity between datavan operators, supervisors, and engineering stakeholders.
Wellbore Visualization in Practice
The display is designed to make step movement and depth context obvious at a glance on high-tempo frac jobs.
Core Functional Requirements
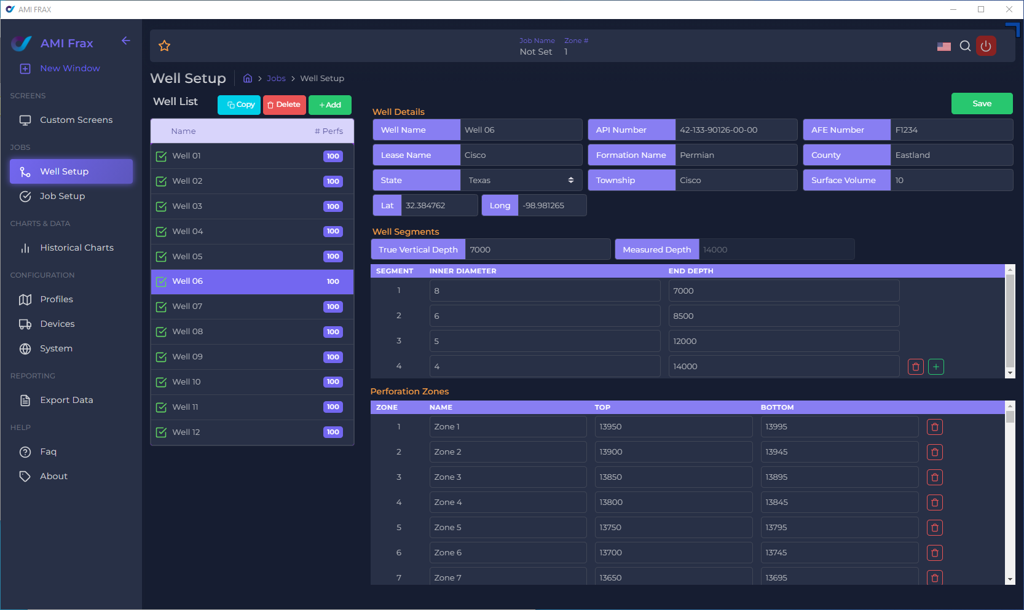
Wellbore Diagram
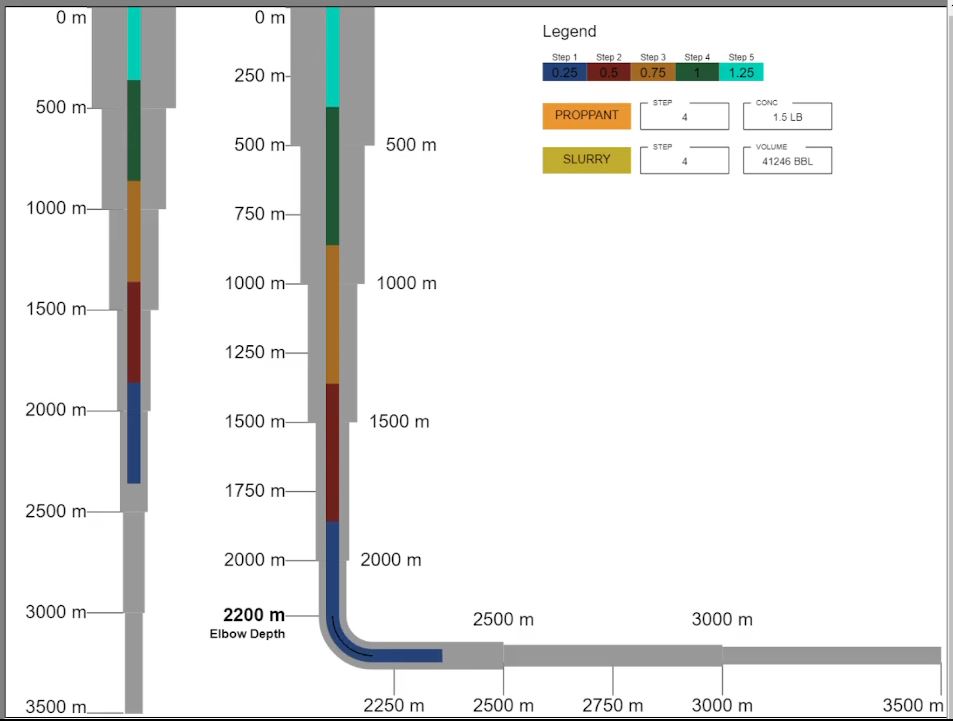
- Render vertical and horizontal well sections from well schematics, including elbow handling for deviated wells.
- Show depth indicators at fixed intervals with clear labels in imperial or metric units.
- Visualize each slurry step with a unique color and a moving depth marker for progression tracking.
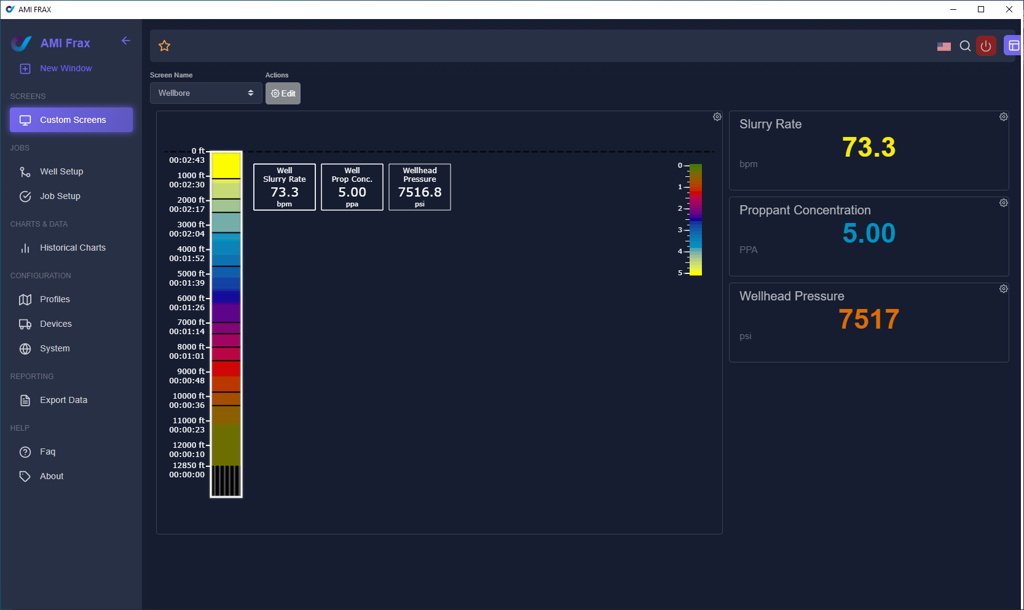
- Display live stage and step slurry/proppant totals from MQTT metrics updates.
- Support light/dark mode plus resize and drag behavior in dashboard layouts.
Slurry Step Tracker
- Provide a safe default state when no job is selected or a job is not running.
- During active jobs, show planned versus actual slurry totals with percentage-based fill bars.
- Match tracker colors to the same step color system used in the wellbore diagram.
- Handle variable step counts with scroll support and persistent scroll position.
- Support light/dark themes, metric/imperial units, and dashboard resize/position controls.
Built for Real-Time Integration
The solution is designed for MQTT over websocket updates so operators always see current depth progression, elbow position, and job metrics without page refreshes.
It also supports light/dark themes, metric or imperial display units, and resize-ready widgets to fit dashboard layouts in field operations.
Data flow highlights
- Well definition: Depth, diameter, and perforation references from MQTT.
- Wellbore state: Step position and elbow depth updated on a running job.
- Job metrics: Stage and step slurry/proppant totals for live comparison.
- UI behavior: Scroll persistence, responsive layout, and readable depth indicators.
Turn Wellbore Data Into Better Field Decisions
We can deliver a production-ready wellbore diagram and slurry step tracker tailored to your schedule logic, naming conventions, and operating workflow.
Discuss Your Wellbore Project